Richest Cities in Montana (2026)
by Kristen Carney
Updated: February 9, 2026
Richest City in Montana
The richest city in Montana is Bridger CDP in Gallatin County with an average household income of $434,663 as of 2024. While exceptionally affluent, Bridger CDP only has a population of 73 as of 2024. The richest city in Montana with at least 5,000 people is Four Corners in Gallatin County with an average household income of $143,742 as of 2024 and 5,791 people as of 2024 according to the most current Census data available (citation).
| Rank | City | County | Population | Average Income | Median Income |
|---|---|---|---|---|---|
| 1 | Bridger CDP | Gallatin | 73 | $434,663 | -$1 |
| 2 | South Hills | Jefferson | 620 | $297,086 | $168,235 |
| 3 | Rollins | Lake | 115 | $221,349 | $124,063 |
| 4 | Homestead | Sheridan | 27 | $205,930 | $162,500 |
| 5 | Glen | Beaverhead | 20 | $200,463 | -$1 |
| 6 | Turah | Missoula | 543 | $194,643 | $130,417 |
| 7 | Big Sky | Gallatin; Madison | 2,445 | $194,482 | $138,805 |
| 8 | Bearcreek | Carbon | 88 | $190,979 | $115,000 |
| 9 | Silver Gate | Park | 114 | $181,810 | -$1 |
| 10 | Rockvale | Carbon | 350 | $181,325 | -$1 |
| 11 | Snowslip | Flathead | 71 | $172,453 | $186,750 |
| 12 | Montana City | Jefferson | 3,092 | $165,307 | $129,755 |
| 13 | Kings Point | Lake | 274 | $163,754 | $75,147 |
| 14 | Helena Valley Northeast | Lewis and Clark | 4,659 | $154,869 | $140,517 |
| 15 | Rocky Point | Lake | 151 | $153,549 | -$1 |
| 16 | Bear Dance | Lake | 220 | $153,025 | $84,732 |
| 17 | Gallatin River Ranch | Gallatin | 127 | $150,356 | $101,250 |
| 18 | Ennis | Madison | 777 | $144,178 | $69,650 |
| 19 | Four Corners | Gallatin | 5,791 | $143,742 | $100,917 |
| 20 | Spokane Creek | Broadwater | 740 | $143,642 | $127,250 |
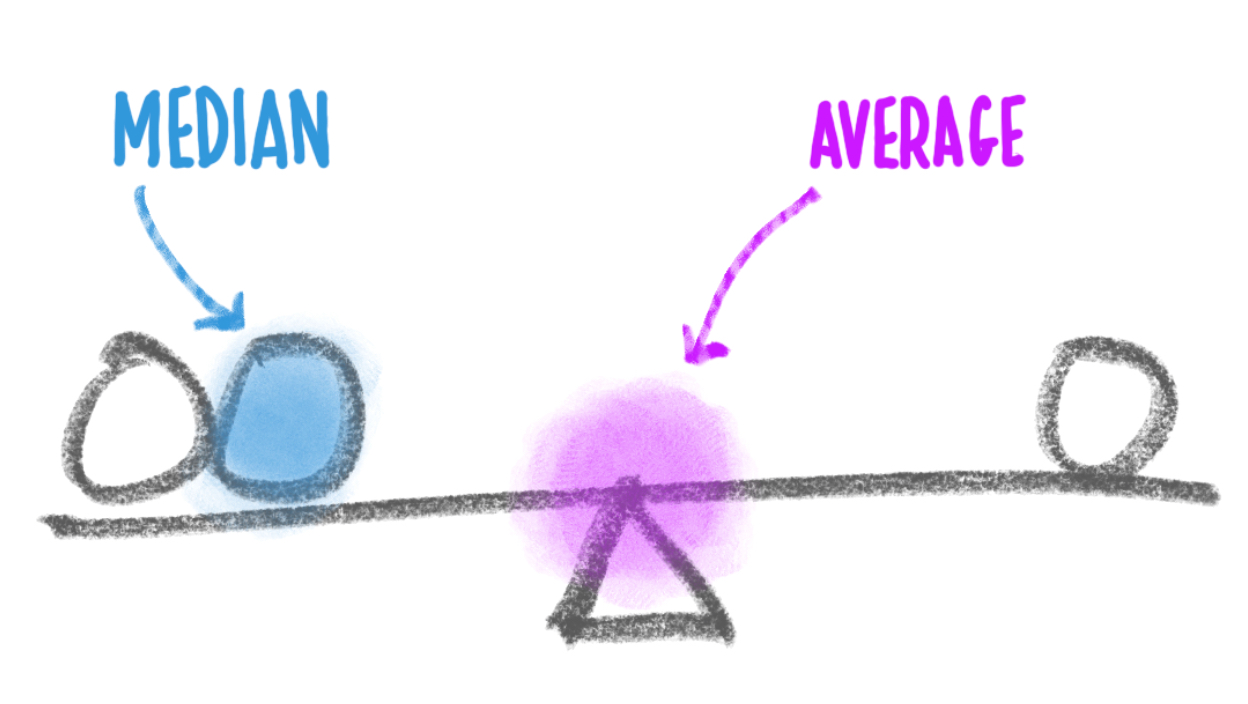
Median Income versus Average Income: Which Should You Use?
We usually suggest using median income data – either instead of or in addition to – average income data as a true indicator of wealth. If you haven’t thought about median versus average since your last standardized test, you aren’t alone. Here’s what they are:
- average is the sum of a set of numbers divided by the count of numbers in the set
- median is the middle number in the set of numbers
Now let’s say you had the following simplified set of income data.
Household 1: $30,000
Household 2: $50,000
Household 3: $1,000,000
The average income for this set is $360,000. The outlier data point ($1,000,000) skews the average WAY up. Conversely, the average income would be skewed WAY down if someone had an income of $500. The median income for the same data set is $50,000. Outlier data doesn’t skew the median.
Most Business Owners Should Use Median Income
So most business owners should use the median income as a true indicator of wealth, because it provides a more accurate representation of a typical income, especially in areas with significant income disparity.
When Should You Use Average Income
If your target market is high-income households, the average income may be more relevant. This is because the average income can highlight the presence of a higher concentration of wealthy individuals, which is beneficial for luxury goods and services marketing. We’re using average income on this page because using the Census’s highest reported median value of $250,001 could result in multiple ties for the richest geography.
Why do so many cities have a median value of $250,001?
The Census' American Community Survey uses $250,000+ as a jam value for median income estimates to protect privacy, ensure data consistency, and simplify reporting. A "jam value" in survey data refers to a placeholder or default value used when actual data points are unavailable, incomplete, or exceed certain thresholds. We represent this jam value as $250,001 to make it easy for you to sort.
You might also be interested in:
Email Me When New Data Are Released
Join thousands of subscribers and receive just 1 (ONE!) email a year in December when the US Census Bureau releases new income data for Montana richest cities.
SOURCES
United States Census Bureau. Annual Estimates of the Resident Population: April 1, 2020 to July 1, 2023. U.S. Census Bureau, Population Division. Web. May 2024. http://www.census.gov/.
United States Census Bureau. B01001 SEX BY AGE, 2024 American Community Survey 5-Year Estimates. U.S. Census Bureau, American Community Survey Office. Web. 29 January 2026. http://www.census.gov/.
United States Census Bureau. B19013 Median Household Income, 2024 American Community Survey 5-Year Estimates. U.S. Census Bureau, American Community Survey Office. Web. 29 January 2026. http://www.census.gov/.
United States Census Bureau. "DP03 SELECTED ECONOMIC CHARACTERISTICS." 2024 American Community Survey 5-Year Estimates. U.S. Census Bureau, American Community Survey Office. Web. 29 January 2026. http://www.census.gov/.
Products & Services
Plumbing
Connect
- 1-800-939-2130
- Contact Us
© Copyright 2026 Cubit Planning, Inc.